.avif)
Traceable API Security Platform Updates - February 2024


February’s releases include analytics for security events, enhancements to session attribution, a new way to visualize sensitive data flows in your application, and new platform agent management features. Here are the details on what’s new:
Security Event Analytics
We have released in-depth analytics for security events to power deeper exploration of security events detected by Traceable. With the new security event analytics, you can identify patterns in security event activity and investigate event activity by several key IOCs (indicators of compromise), threat actor, threat type, API endpoint threat parameters, and source of traffic (BOT, Proxy, Organization etc.). You will now find an “Events” tab in analytics, where you can search, filter, and group security events by 60+ parameters.With security event analytics you can:
- Identify trends in threat types and specific malicious behavior impacting your organization
- Identify and investigate spikes in event activity which are useful indicators of distributed, volumetric or BOT based attacks
- Identify and investigate spikes in threat activity and correlate them with vulnerabilities seen in AST or other security testing tools.
- Group security events by threat actor to see which actors have been most active in your environment and identify any patterns of activity from specific actors
- Investigate all security events that occurred on high risk API endpoints that carry sensitive data
- Identify trends in event types impacting your organization using API context like authentication type, encryption, HTTP method, security headers etc
- Do forensic analysis on all APIs a threat actor accessed during an attack to quickly gather relevant information such as sensitive data, financially relevant data, auth tokens, etc.

Enhanced Session Attribution
We have made improvements to session attribution to improve detection of session-based attack techniques such as Broken Object Level Authorization (BOLA), session fixation, land speed violations, and session hijacking. These updates allow us to more accurately attribute API activity and events to user sessions, and identify when and how sessions have been compromised. Since user attribution relies heavily on sessions being identified accurately, customers get better coverage there too. Improvements include:
- Ability to extract session identification attributes from API requests and responses, with granular configuration of session identification rules in User Attribution Administration.
- Identifying session tokens in request header/body, cookies
- Session stitching to tie multiple client sessions to a logical user session (e.g. a browser refresh would result in multiple client sessions, but we can stitch them together to show the true user session). Session ID (the stitched user session) and the Client Session ID are available in Threat Activity and Security Analytics.
With Session ID in analytics, you can now:
- Identify all sessions from a specific user or threat actor
- Zoom in on a specific session to examine all API transactions and events that occurred in the session
- Hunt for instances of session based attacks like BOLA, session fixation, etc. by looking for instances where multiple users or IPs are riding on an existing session to carry out attacks.

Sensitive Data Flows in Application Flow Dashboard
The Application Flow dashboard has been redesigned to improve visibility into how sensitive data is flowing within your app and to third-party endpoints. The dashboard automatically identifies gateways, load balancers, proxies, and other applications services, and visually maps data flows between them. You can explore all data flows or filter based on data sensitivity or service risk level to easily identify risky flows.
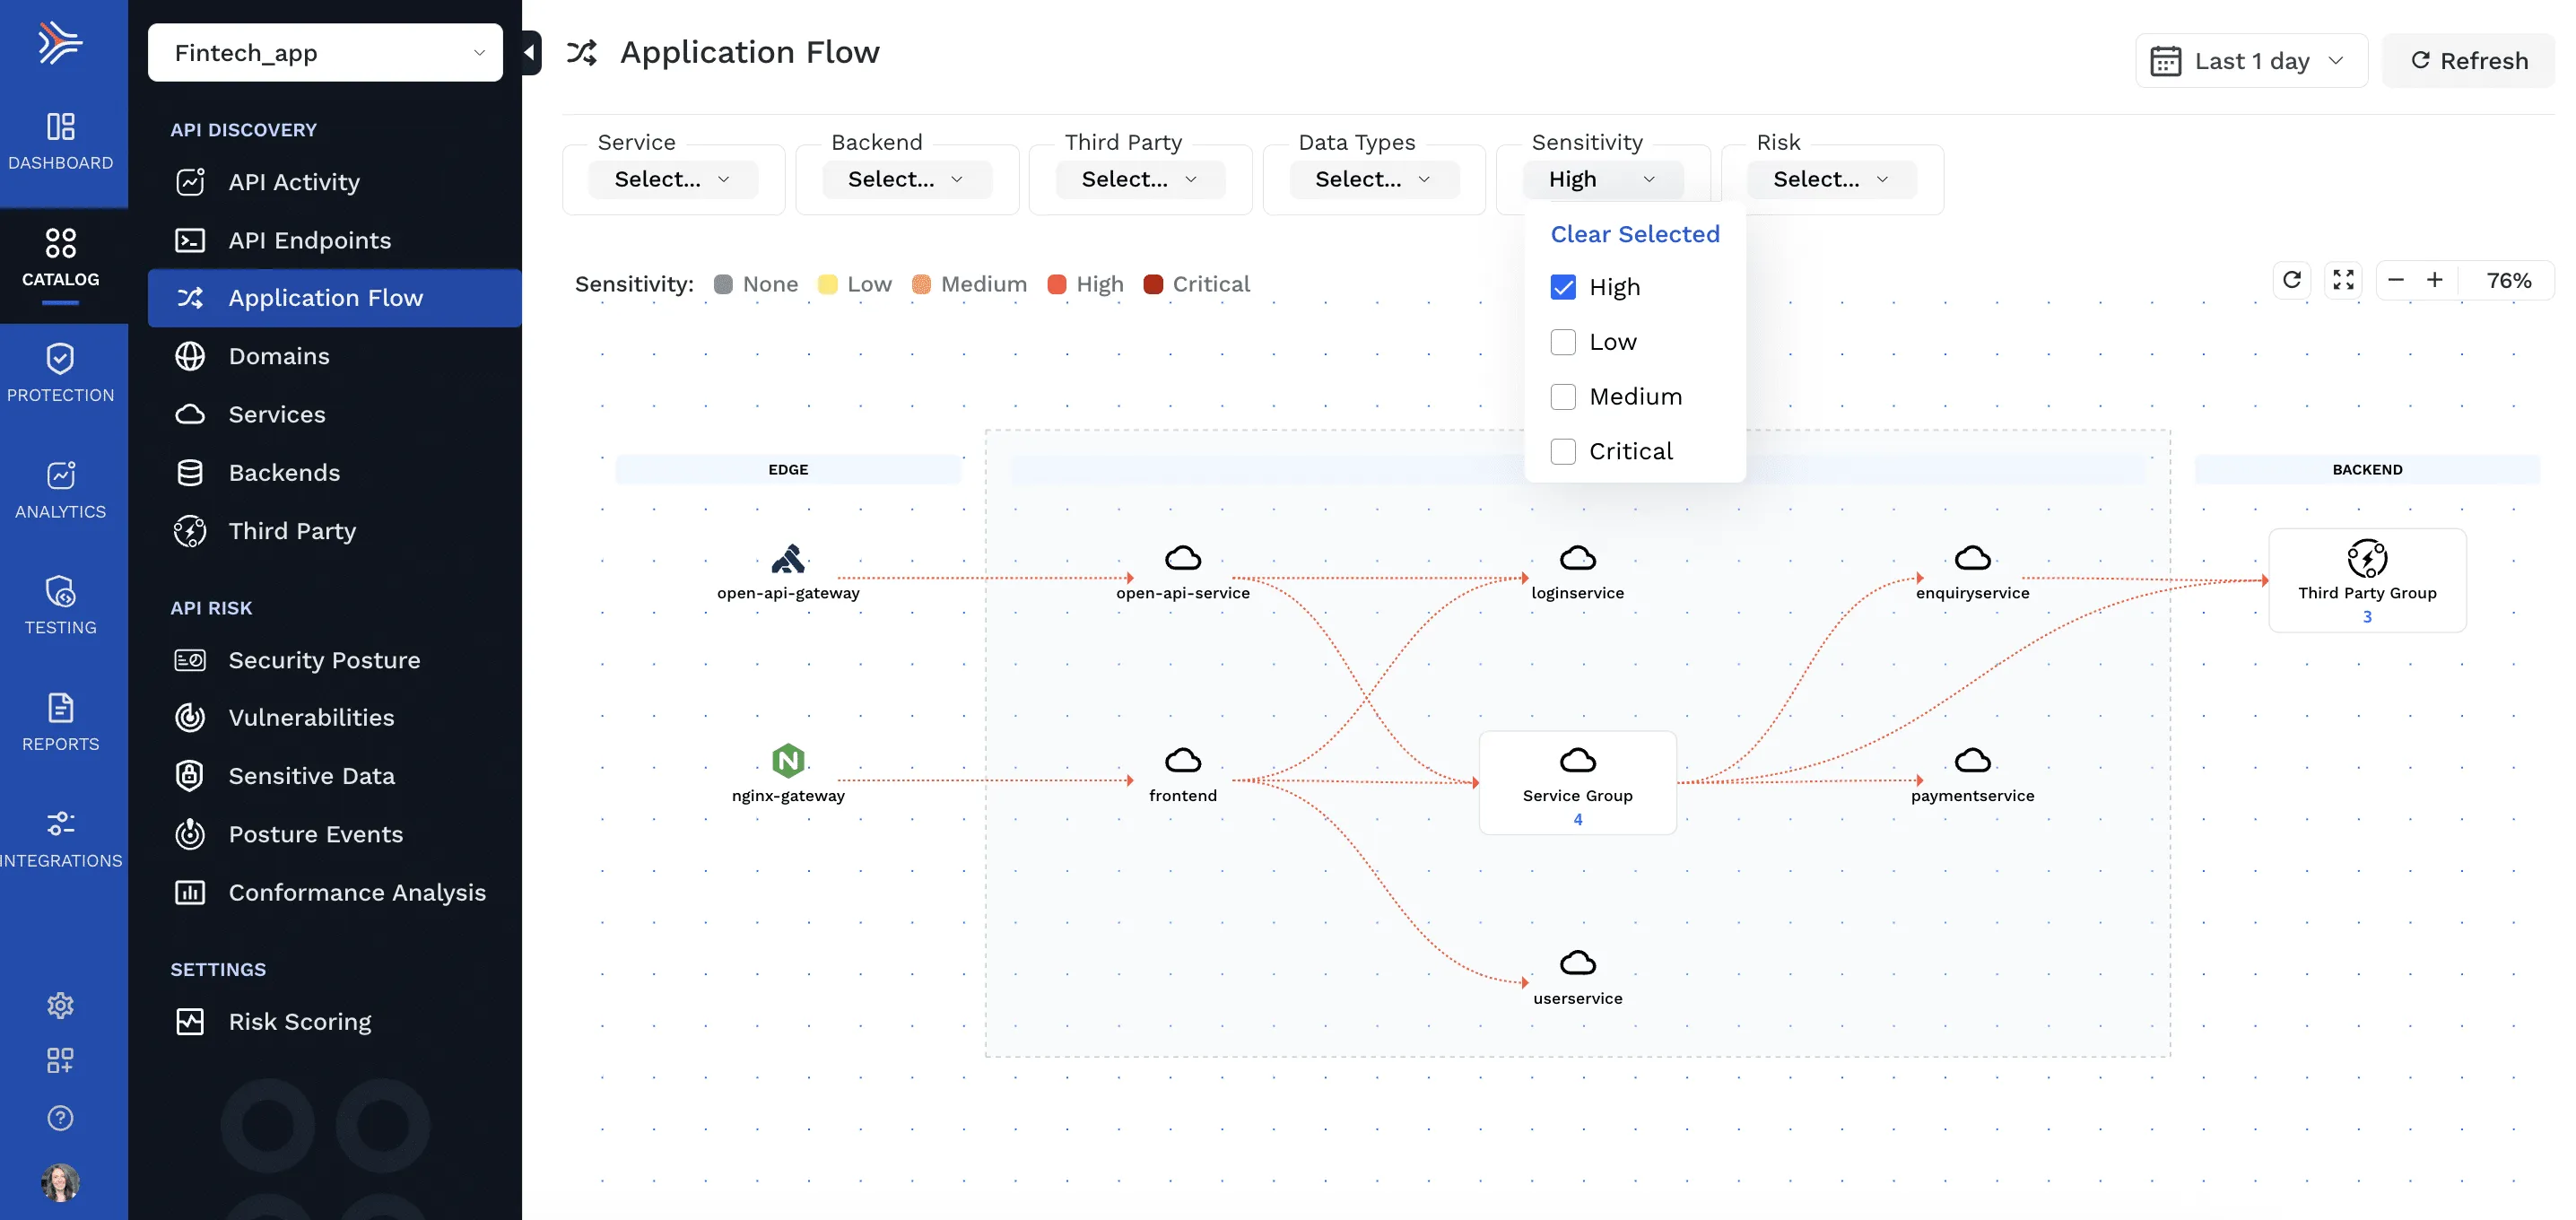
Click into any individual service to see a detailed API-level breakdown of the sensitive data coming in and out. This includes sensitive data types contained in the request and response for each API endpoint associated with the service.

Platform Agent Management Updates
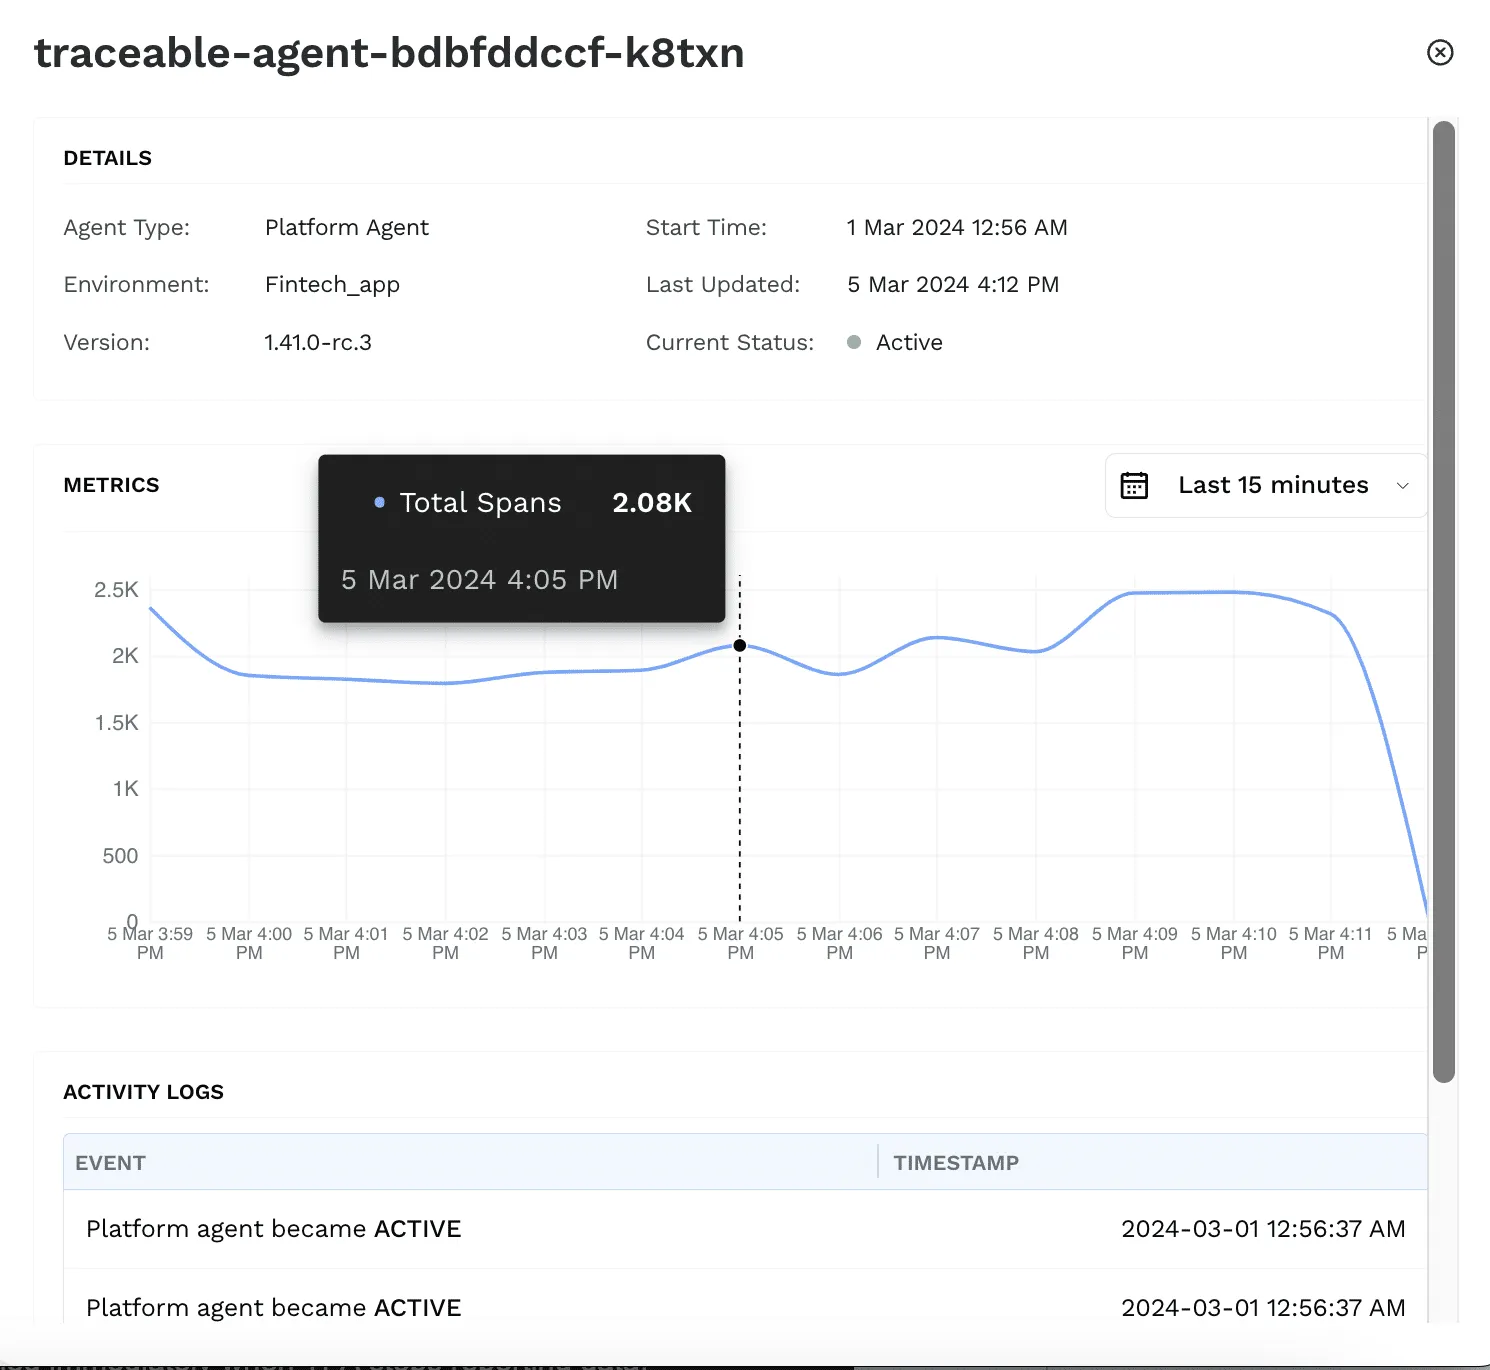
We’ve added new metrics for monitoring the health of your platform agents and new notification options to alert you to agent status changes and data collection issues. Navigate to Administration > Data collection to see a full list of platform agents. Click on any agent to view the new metrics tab, which now shows agent identification details, a graph view of data sent to the platform (spans per minute), and an agent status changelog.
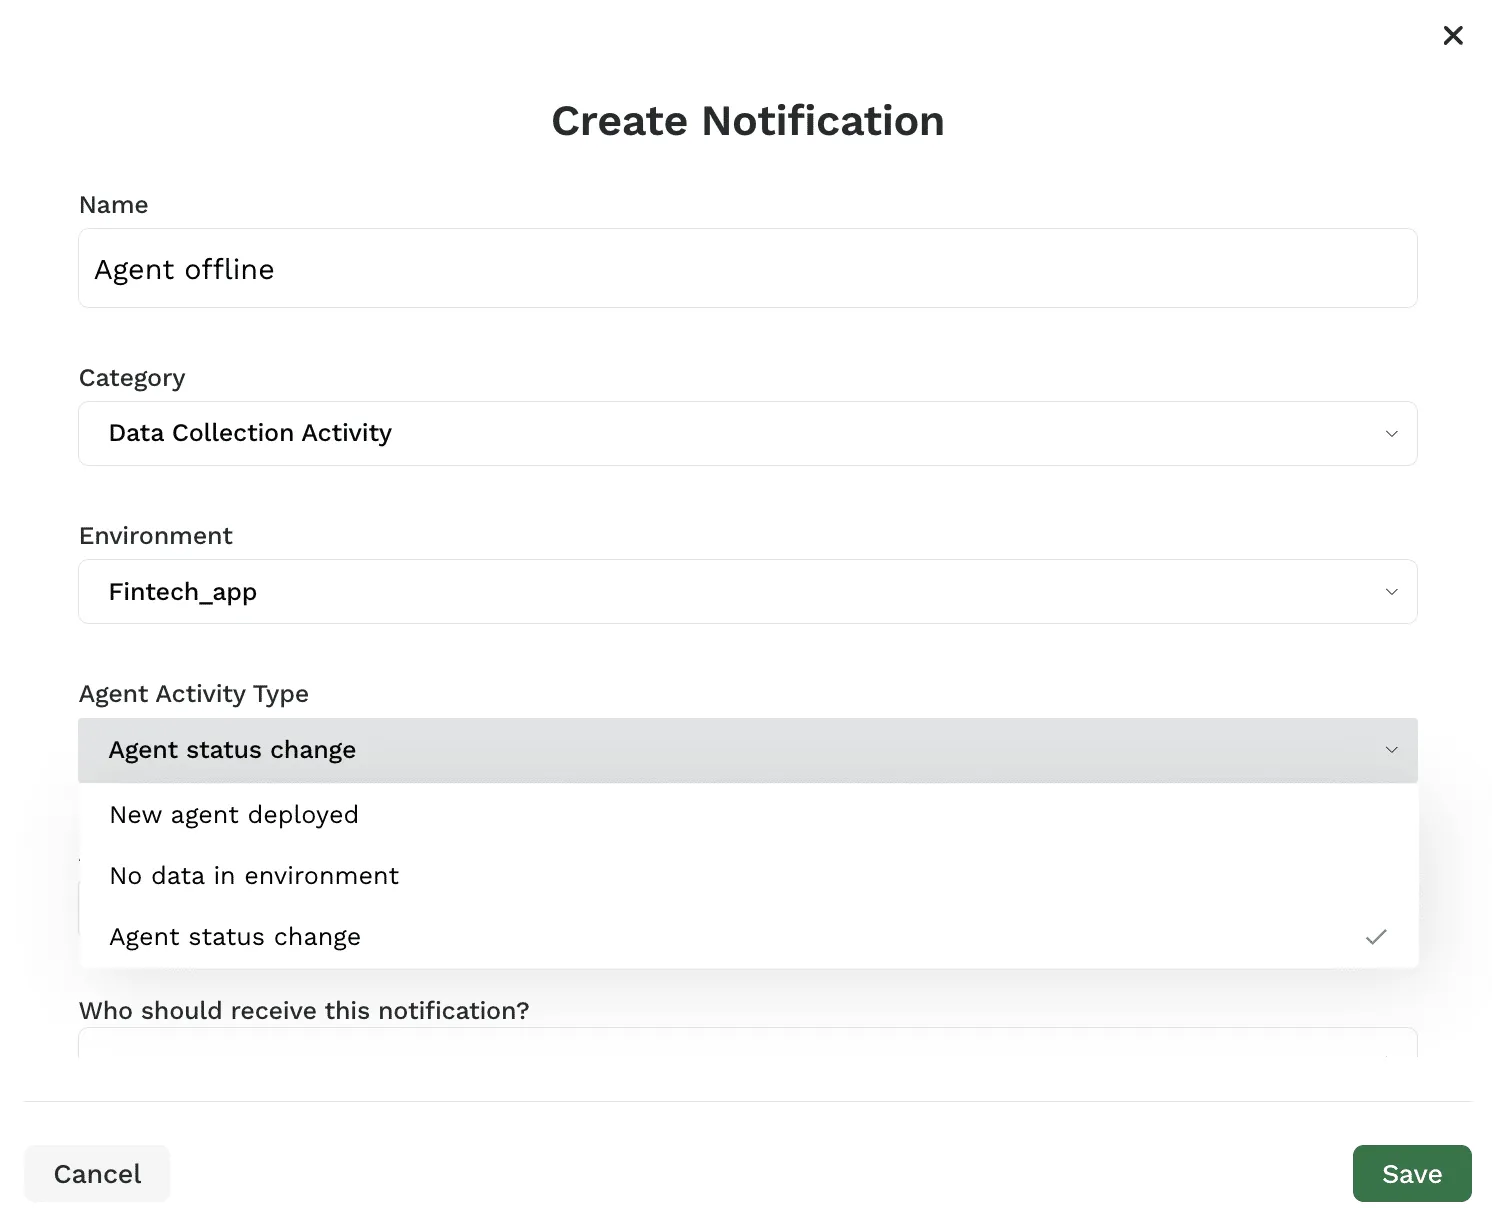
You can create new notifications to receive an alert when your environment stops reporting data and when the status of a platform agent changes. Navigate to Administration > Notifications > Create Notification. Select “Data Collection Activity” as the notification category and choose from the options in “Agent Activity Type” to create a notification on your desired activity.
The Inside Trace
Subscribe for expert insights on application security.


